A practical guide to creating A/B and Multivariate Tests
What is A/B Testing?
A/B testing (also known as bucket testing or split-run testing) is a method of testing the performance of two variants of an entity (Eg web page, email) by performing a controlled experiment. A/B Testing is a way to compare two versions of a single variable, by testing the user’s response to variant A against variant B and determining which of the two variants are effective.
How to Perform A/B Test?
Let us take the example of a hypothetical e-commerce store, where we would like to find out the best landing page which has a better opportunity for conversion.
Create a new version of the existing landing page which you think has a better chance of increasing the conversion rate of the store. Now let the traffic in your e-commerce store flow through the old landing page and the new landing page in equal proportions (50:50).
The old landing page is now the control group (A) and the new landing page is the variation (B).
Run this test for some time (More on how long to run later) and analyze the results.
Analyzing the results of A/B testing:
Let us consider the outcome of the test in two different scenarios.
Scenario 1:
| Number of Visitors | Conversions | |
|---|---|---|
| Control Group (A) | 1000 | 100 |
| Variation (B) | 1000 | 125 |
Even though the conversion rate of Variation (B) looks better than the Control Group (A), it is not statistically significant and we can’t tell with confidence if Variation (B) is better (under default conditions).
Scenario 2:
| Number of Visitors | Conversions | |
|---|---|---|
| Control Group (A) | 1000 | 100 |
| Variation (B) | 1000 | 130 |
Here the conversion rate of Variation (B) is better than Control Group (A) in a statistically significant way (under default conditions). Even though Variation (B) in both scenarios is similar they both have different statistical significance levels.
(If you are curious what the default conditions for statistical tests are then they are significance level of 0.05 and a two-tailed test.)
How to determine if the result obtained in an A/B test is statistically significant?
The Significance Test that we are about to perform is Z-Test.
It begins with defining a Null Hypothesis H0 which is believed to be true. The assumption in our example is that the conversion rate has remained the same despite the changes in the landing pages.
H0: conversion rate = 10% ( This can be obtained by historical data of conversion rate of the e-commerce store)
The next step is to state the Alternate Hypothesis Ha, a statement what a statistical hypothesis test is set up to establish. The assumption in our example is that the new landing page has either increased or decreased the conversion rate of the store.
Ha: conversion rate != 10%
The new sample evidence obtained by running the variation (B) is used to determine the validity of the null hypothesis. We can reject the null hypothesis when the probability (known as P-value) of it being true is less than a certain threshold. This threshold is often called the Significance Level (alpha).
We must pre-define the Significance Level before running the test. The usual value for Significance Level is 5%.
There are two types of Z-tests namely, One-Tailed Test and Two-Tailed Test.
One-tailed Test:
A one-tailed test is performed when we are interested in the possibility of the relationship in one direction of interest, and completely disregarding the possibility of a relationship in another direction. The one-tailed test can be classified into two types either a left tail test and right tail test depending on the alternate hypothesis.
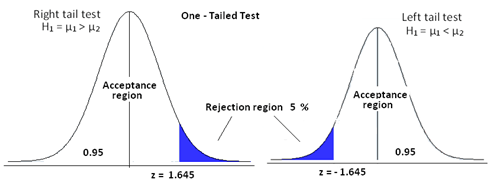
When the alternate hypothesis has the condition
- μ1 > μ2, we perform right-tailed test.
- μ1 < μ2, we perform left tailed test.
μ is the conversion rate in the e-commerce example.
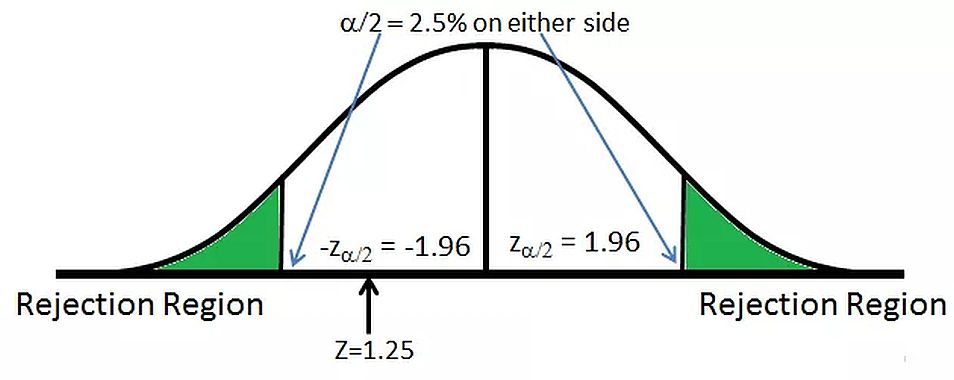
Two-tailed test
A two-tailed test is performed when we are interested in the possibility of the relationship in both the sides of the distribution. Half of the significance level on either side of the distribution curve is the rejection region.
Eg When the Significance level is 5%, 2.5% is the rejection region on both sides of the distribution.
We perform the two-tailed test when the alternate hypothesis has the condition
- μ1 ≠ μ2
μ is the conversion rate in the e-commerce example.
Calculation of P-Value
Calculation of P-value is done in two steps:
1. Calculation of Z score by the formula
\[z = \frac {\hat{p} - p_0} {\sqrt{\frac{\hat{p} (1-\hat{p} )}{\hat{n}} + \frac{p_0 (1-p_0 )}{n_0}}}\]Where
- \(\hat{p}\) -> sample proportion (conversion rate of variant)
- \(p_0\) -> assumed proportion (conversion rate of control)
- \(\hat{n}\) -> sample size of sample proportion (Visitors of variant)
- \(n_0\) -> sample size of assumed proportion (Visitors of control)
In the case of e-commerce store example assumed proportion is the conversion rate of the control group and the sample proportion is the conversion rate of the variation.
2. Lookup of P-value from the Z table shown below.
Depending on the type of test (One-sided or Two-sided) find the P-value from the z-score.
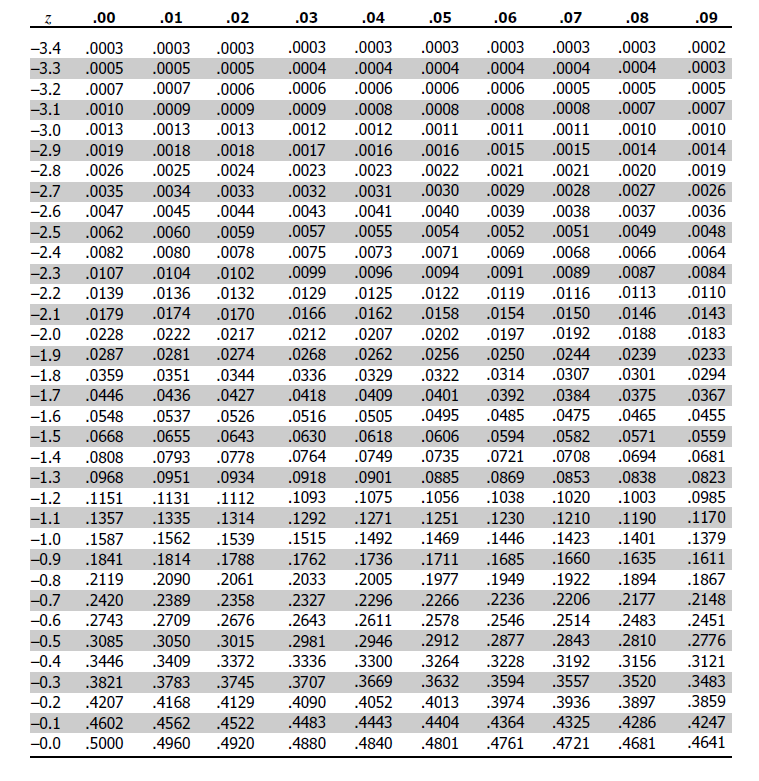
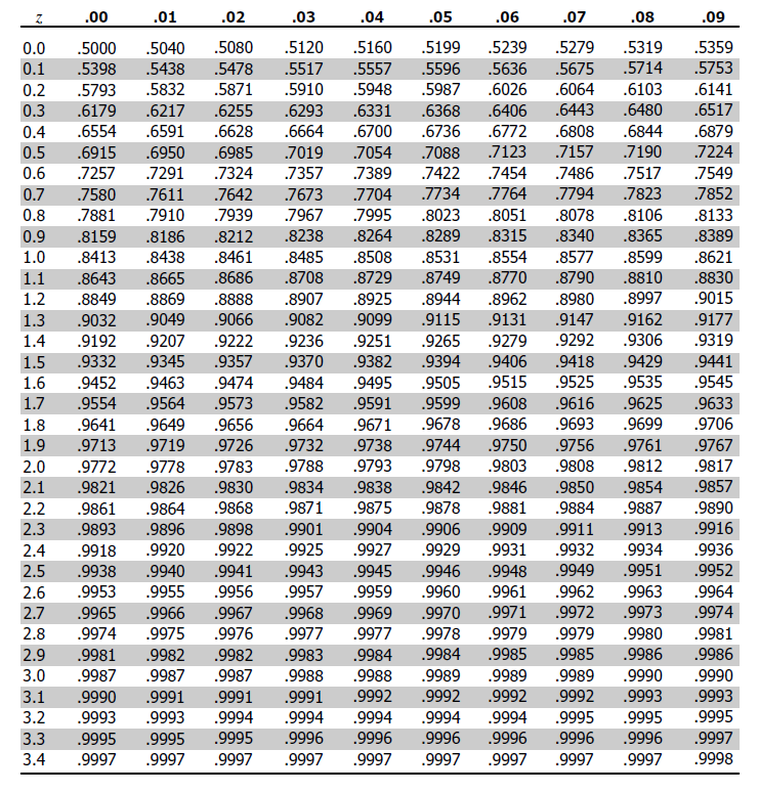
If the corresponding P-value is less than the Significance Level we can reject the null hypothesis and declare new findings as statistically significant.
Determining the Sample Size for Tests
The sample size must be predefined before we start significance tests. To calculate the sample size, we need to understand Power in Tests of Significance and Minimum Detectable Effect (MDE)
Power is defined as the probability of making a correct decision (to reject the null hypothesis) when the null hypothesis is false.
The conventional value for power in a significance test is 80% (0.8) and this is pre-defined before running the test. (Similar pre-defining significance level)
The Minimum Detectable Effect (MDE) represents the relative minimum improvement over the baseline that you’re willing to detect in an experiment, to a certain degree of statistical significance. MDE is a parameter that measures how the sensitivity of the test. If the experiment is less sensitive (High MDE) then a low sample size is sufficient and if the experiment is more sensitive (Low MDE) more sample size is required.
The conversion rate of the control can be estimated by using historical data. By using the MDE we can assume the conversion-rate of the variant.
\(conversion\)-\(rate_{variant} = conversion\)-\(rate_{control} * (1 +MDE )\)
\[n = \frac{ (\hat{p} (1-\hat{p} ) + p_0 (1-p_0 )) (z_{(1-\alpha/2)} + z_{(1-\beta)})^{2} } { ( \hat{p} - p_0)^2 }\]Where
- \(\hat{p}\) -> Sample proportion (conversion rate of variant)
- \(p_0\) -> Assumed proportion (conversion rate of control)
- \(\alpha\) -> Significance Level
- \(\beta\) -> Power
- \(z\) -> Z-Score of a normal distribution
Multivariate Testing
Multivariate testing is a technique for testing a hypothesis in which multiple variables are modified. Multivariate testing uses the same core mechanism as A/B testing but compares a higher number of variables instead of one variation.
For eg in the case of e-commerce, store changes are made to multiple sections of a landing page, and then variations are created for all the possible combinations of those changes.
Variation on Element A * Variation on Element B * …. = Total Variations
The traffic in multivariate tests will be split by N ways where N is the number of variations including the control group.
Downsides of Multivariate Testing
The main challenge for executing multivariate tests is the number of samples required to reach statistically significant results. As the number of variations increases, the number of samples needed also increases multiplicatively.
In the e-commerce store, the traffic on the landing page is often limited and it may take a long time before we can reach statistical significance. The A/B testing often avoids this problem since the traffic for the experiment is split in half between control and variation.
Summary
A/B testing is best when you have less traffic on your landing page and need to conclude the test faster. Multivariate testing is best when you have a lot of traffic and can afford to split the traffic in N ways. Even though A/B testing and Multivariate testing have both pros and cons they are nonetheless both powerful optimization tools that help you find the best variant in your experiment.