TL;DR
- ElastAlert runs on top of Elasticsearch
- Out-of-the-box constructs for most alerting use-cases
- Easily extensible for custom rules and alerts
- Docs | GitHub
- Heimdall Repository (Private Repository)
What is ElastAlert?
ElastAlert is an application/framework that has the basic constructs necessary to build an alerting system on top of the Elasticsearch. It was built by the engineering team at Yelp.
If you have data being written into Elasticsearch in near real time and want to be alerted when that data matches certain patterns, ElastAlert is the tool for you. If you can see it in Kibana, ElastAlert can alert on it.
Recommended Reading
- Heimdall Readme - “Intro (from email)” (Private Repository)
- Yelp Engineering Blog on ElastAlert Part 1 | Part 2
- ElastAlert GitHub Readme
Why ElastAlert?
ElastAlert truly provides real world alerting rule types like spike, frequency, metric aggregation. On top of that, you can use the any rule type to define alerts using any query on Elasticsearch.
It supports many common notification endpoints - email, jira and slack for example.
Kibana’s Watcher is part of their X-Pack subscription (not free). Although Kibana’s watcher does support alerting, it’s not as awesome as ElastAlert. I’ve personally never used Kibana Watcher - so I don’t have too much to say about it.
The recent Open Distro for Elasticsearch has open source alternatives to some X-Pack features. The Alerting feature is pretty close to Watcher - and I’ve given it a shot. Read on for my comparison of ElastAlert and Open Distro Alerting. I’d still pick ElastAlert over it though!
ElastAlert in Action
Let’s understand ElastAlert using some examples.
Spike In Failures
Let’s take an example of a common alerting scenario - a spike in failures. To determine that there is a spike, you need the current failures and the past failures.
Example
Let’s assume we have some events in Elasticsearch.
{"xevent": "xerror", "xb": "xb1", "xmv": "1.2.14", "message": "FEATURE_NOT_SUPPORTED",   "createdatts": "2020-01-30T03:27:37.084Z"}

{"xevent": "xerror", "xb": "xb2", "xmv": "1.2.14", "message": "SERVICE_UNAVAILABLE",     "createdatts": "2020-01-30T04:27:37.084Z"}

{"xevent": "xerror", "xb": "xb2", "xmv": "1.2.14", "message": "DeadObjectException",     "createdatts": "2020-01-30T05:27:37.084Z"}
And let’s take a scenario where failures are on the rise.
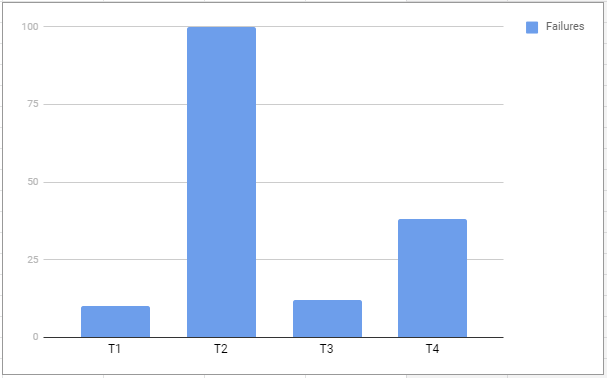
At time T1 - failures are 10.
At time T2 - failures are 100.
This would mean a spike of 10x from T1 to T2. See the graph below to picture this.
Let’s see what the Spike Rule Type means
This rule matches when the volume of events during a given time period is spike_height times larger or smaller than during the previous time period. It uses two sliding windows to compare the current and reference frequency of events. We will call this two windows “reference” and “current”.
To create a rule to detect a spike of failures (per xb), we can configure a spike rule as below.
type: spike
name: "Spike up in task failures"
description: "Alert if there is a spike in task failures. If min 10 failures in the last 1 hour and it spikes 3x to 30 failures"

# Read the documentation for full understanding of the config
# https://elastalert.readthedocs.io/en/latest/ruletypes.html#spike

index: logstash-*

threshold_ref: 10
threshold_cur: 30

timeframe:
  minutes: 60

spike_height: 3
spike_type: "up"

doc_type: "doc"

# THIS ENSURES ALERTS ARE PER xb
use_terms_query: true
query_key: "xb"

# THIS GIVES THE TOP 5 xmv and message
top_count_number: 5
top_count_keys:
- "xmv"
- "message"

# THIS ALLOWS US TO FILTER EVENTS
filter:
- query:
    query_string:
      query: "xevent: xerror AND xmv: *"
- type:
    value: "doc"

alert:
- slack

slack_webhook_url:
- "SLACK_WEBHOOK_URL_HERE"
As you can see, this easy config can do everything needed to capture a spike of failures. You can also configure a spike_type: "down" to automatically alert once the failures have gone down.
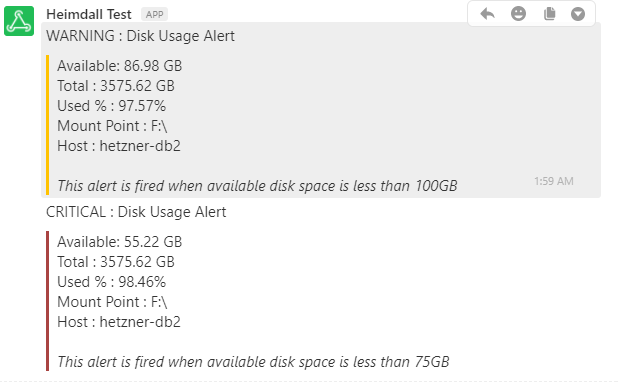
Disk Usage Warning
name: "WARNING : Disk Usage Alert"
description: "Warning alert when DB's disk usage is below 75GB"
is_enabled: true

# Reference - https://github.com/Yelp/elastalert/issues/1807#issuecomment-451498753

index: metricbeat-6.5.0-%Y.%m.%d
use_strftime_index: true

type: any

realert:
  minutes: 15

filter:
- type:
    value: "doc"
- query:
  - query_string:
      query: 'metricset.name: filesystem AND beat.hostname: (server-1 OR server-2) AND system.filesystem.mount_point: "F:\\"'
- query:
  - query_string:
      query: "system.filesystem.available: (>50000000000 AND <75000000000)"

query_delay:
  minutes: 1
query_key: host

alert_text_type: alert_text_only
include : ["host.name","system.filesystem.used.pct","system.filesystem.mount_point","system.filesystem.available","system.filesystem.total"]

# Custom enhancement to convert “bytes” to GBs to make alert more readable
# Reference: https://github.com/Yelp/elastalert/issues/851
match_enhancements:
- "elastalert_modules.my_enhancements.MyEnhancement"

slack_text_string: "WARNING : Disk Usage Alert"
slack_username_override: "#ffc200"

alert:
- "slack"

alert_text: "Available: {3} GB <br />
Total\t\t: {4} GB <br />
Used %\t\t: {0:.2%} <br />
Mount Point\t: {2} <br />
Host\t\t: {1} <br /><br />
<i>This alert is fired when available disk space is less than 75GB</i>"

alert_text_args: ["system.filesystem.used.pct","host.name","system.filesystem.mount_point","system.filesystem.available","system.filesystem.total"]

slack_webhook_url:
- "SLACK_WEBHOOK_URL_HERE"
Getting Started with ElastAlert
I suggest running ElastAlert using the docker image provided by bitsensor. This a modified version of ElastAlert that exposes REST APIs for ElastAlert.
I also recommend installing the ElastAlert Kibana Plugin to help you create rules using a UI and test them.
Once you’ve got it running, try out some easy rules from the ElastAlert Example Rules.
ElastAlert vs Open Distro Alerting
Open Distro for Elasticsearch is pretty good - it enables some key features that are lacking in the open source versions of ELK stack. I hear that it is pretty similar to Watcher. To help understand the difference between ElastAlert and Open Distro Alerting, let’s revisit the spike example from before.
Open Distro Alerting works using 3 components - Monitor, Trigger and Action.
Monitor
Elasticsearch Query to Retrieve Errors which creates 2 time buckets and aggregate errors - “previous” and “current”.
{
    "size": 0,
    "query": {
        "bool": {
            "must": [
                {
                    "exists": {
                        "field": "xmv",
                        "boost": 1
                    }
                },
                {
                    "term": {
                        "xevent": {
                            "value": "xerror",
                            "boost": 1
                        }
                    }
                },
                {
                    "range": {
                        "createdatts": {
                            "from": "now-2h",
                            "to": "now",
                            "include_lower": true,
                            "include_upper": true,
                            "boost": 1
                        }
                    }
                }
            ],
            "adjust_pure_negative": true,
            "boost": 1
        }
    },
    "aggregations": {
        "by_hour": {
            "date_range": {
                "field": "createdatts",
                "ranges": [
                    {
                        "from": "now-2h",
                        "to": "now-1h"
                    },
                    {
                        "from": "now-1h",
                        "to": "now"
                    }
                ],
                "keyed": false
            }
        }
    }
}
Sample response of the above query
{
    "_shards": {
        "total": 85,
        "failed": 0,
        "successful": 85,
        "skipped": 0
    },
    "hits": {
        "hits": [],
        "total": 1604,
        "max_score": 0
    },
    "took": 24,
    "timed_out": false,
    "aggregations": {
        "by_hour": {
            "buckets": [
                {
                    "from_as_string": "2020-01-30 01:11:33.605",
                    "doc_count": 1386,
                    "to_as_string": "2020-01-30 02:11:33.605",
                    "from": 1580346693605,
                    "to": 1580350293605,
                    "key": "2020-01-30 01:11:33.605-2020-01-30 02:11:33.605"
                },
                {
                    "from_as_string": "2020-01-30 02:11:33.605",
                    "doc_count": 218,
                    "to_as_string": "2020-01-30 03:11:33.605",
                    "from": 1580350293605,
                    "to": 1580353893605,
                    "key": "2020-01-30 02:11:33.605-2020-01-30 03:11:33.605"
                }
            ]
        }
    }
}
Trigger
Determine whether to fire an alert
def prev = ctx.results[0].aggregations.by_hour.buckets[0].doc_count;
def curr = ctx.results[0].aggregations.by_hour.buckets[1].doc_count;

def spikeType = "";
if (prev < curr)
    spikeType = "UP";
else
    spikeType = "DOWN";

def hasErrors = ctx.results[0].hits.total > 0;

return spikeType == "UP"
Action
Take an action when the trigger fires an alert
A spike UP in errors was detected!
- Current Errors:
- Previous Errors:
- Monitor:
- Trigger:
- Severity:
- Period start:
- Period end:
Sample message
A spike UP in errors was detected!
- Current Errors: 201
- Previous Errors: 1399
- Monitor: AY-Test-Spike
- Trigger: AY-Test-Spike-Trigger-Up
- Severity: 1
- Period start: 2020-01-30T03:12:51Z
- Period end: 2020-01-30T03:13:51Z
As you can see - there is a lot more to do to set up alerts. Common alert types (like spikes / rate of increase / etc) require serious ES Query wizardry. It works fine - just not as easy as ElastAlert. ElastAlert abstracts the ES query complexity and allows for simple configuration based alerts.
Closing Thoughts
ELK has been the de-facto stack for logging and monitoring. ElastAlert builds on top of this and enables easy and flexible alerting.
It has almost everything you need to build an alerting system on top of Elasticsearch.
Additionally, there are a few tools built around ElastAlert - that may remove the need for writing YAML configs also!
- ElastAlert API + Docker Image by bitsensor
- ElastAlert Kibana Plugin by bitsensor
- Praeco by ServerCentral
ElastAlert has saved us on multiple occasions. It started off with me watching the alerts closely and looping in team members as and when necessary.
Ever deployed a big change but weren’t sure if everything was ok? ElastAlert handles that for us - The spike rule catches any service that fails suddenly.
Not sure if your service is performing well? ElastAlert sends a “Long Running Task” alert that can help you identify slow workers.
What about the disk space on the database? ElastAlert sends Warning and Critical alerts when available disk space falls below the threshold. ElastAlert has helped us bring down our failure rate and has been a guardian for our services.

