Users are exposed to different channels on their way to conversion and advertisers keep track of these journeys and want to know the effectiveness of a channel. In this blog we will take a look at how Shapley Value method can be used for attribution in digital advertising.
Introduction
The problem of measuring the influence of each campaign or channel on a conversion is referred to as attribution problem.
Why is this important ?
This kind of analysis helps advertisers distribute budget efficiently according to channel effectiveness. Several heuristic based models have been used such as Last Click Attribution, First Click Attribution etc. but they don’t cover issues like at what point did a user interact with a channel, how many times a channel appeared in a user journey etc. In the paper by Zhao et al. they proposed to use Shapley Value Methods to digital advertising.
Simple heuristic methods like first click and last click just give the entire share of conversion to first and last click respectively in the user journeys. Shapley value method is general credit allocation approach in cooperative game theory. It is based on evaluating the marginal contribution of each player in a game. The credit assigned to each individual player, i.e. Shapley value, is the expected value of this marginal contribution over all possible permutations of the players.
Shapley Value Method
One way to solve this problem is to respect the sequence and keep track of the marginal contribution of the player ( channel ) joining the coalition ( journey ), so for example if there are three players Ava, Bill and Christine and they have individual payoffs. If Ava was the first to join the coalition with payoff of 5 and then Bill joined the coalition and increased the payoff to 9 and then Christine joined to bump it to 11, then player’s respective payoff would be ( 5, 4, 2 ), but there is one problem we have not looked at, the case where Bill would have joined the coalition before Ava and this would change the marginal contribution of Bill and Ava. To solve this we use Shapley Value method which tries to find each player’s marginal contribution averaged over all possible sequences, we would look into all possible arrival sequences and calculate the marginal contribution of every player.
Let’s take an example
v(∅)=0, v({1})=1, v({2})=0, v({3})=1 , v({1, 2})=4 , v({1, 3})=3, v({2, 3})=5, v({1, 2, 3})=8
be the individual payoffs of the participants which in our case would be channels and we can look at these payoffs as the number of conversions delivered by the corresponding players.
| Order of Entry | Player 1 | Player 2 | Player 3 | Total |
|---|---|---|---|---|
| 123 | 1 | 3 | 4 | 8 |
| 132 | 1 | 5 | 2 | 8 |
| 213 | 4 | 0 | 4 | 8 |
| 231 | 3 | 0 | 5 | 8 |
| 312 | 2 | 5 | 1 | 8 |
| 321 | 3 | 4 | 1 | 8 |
| Average | 14 / 6 | 17 / 6 | 17 / 6 | 8 |
The 6 different orders of the players are listed along with the payoffs to the players. In the first row, the players enter in the order 1, 2, 3. Player 1 receives v(1) = 1 upon entry; then Player 2 receives v(1, 2) − v(1) = 4 − 1 = 3; finally Player 3 receives v(N) − v(1, 2) = 8 − 4 = 4. Each of the six rows is equally likely, probability 1/6 each. The Shapley value is the average of the six numbers in each column.
Improvements to Shapley Value Method
This implementation suffers from computation burden as we have to iterate over all possible sequences, just to give an idea for 20 channels we have 1,048,576 coalitions to consider which becomes infeasible to work with at large scale. Let’s look at an example
for channel x1 with P = {x1, x2, X3},
the Shapley value is,
𝜙1 = 𝑅(x1) + 1 / 2 * 𝑅(x1, x2) + 1 / 2 * 𝑅(x1, x3) + 1 / 3 * 𝑅(x1, x2 , x3)
where R(x) represents the value created by the combination.
A straightforward benefit of the new formula is that it greatly improves the computational efficiency. Instead of looping over all possible coalitions for each channel to calculate its marginal contribution, we evaluate each coalition at most once for each channel to directly calculate its Shapley value which means that for example in the term (1/3) * 𝑅(x1, x2 , x3) all of the three participants will get equal share of the conversions delivered by the combination.
Ordered Shapley Value Method
We can extend the Shapley value method to incorporate the ordering effect of the channels. The biggest drawback is that the order in which channel appears in the journey has no bearing on the attribution value that it gets, but we know that a channel serves different purpose at different stage of user journey. To incorporate this we also look at the touchpoint index as well. We look at all the converting paths which is what we referred to as coalition earlier.
[['', '', '', '', '101', '102', '1'],
 ['', '', '', '1', '5', '1', '1'],
 ['', '', '5', '5', '1', '1', '1']]
So this is an example of a sample journey where column length equals length of the longest path which happens to be 7 in this case.
The first row says the interaction of the user just before converting is with channel 1, we will look at the number of conversions brought by this combination and this would get split into participants (1, 101, 102) which further gets split into touchpoint 0, 1, 2 which is where we have observed interactions. '' is used for padding to make sure every path is of the same length which eases computation.
The final result would look something like this.
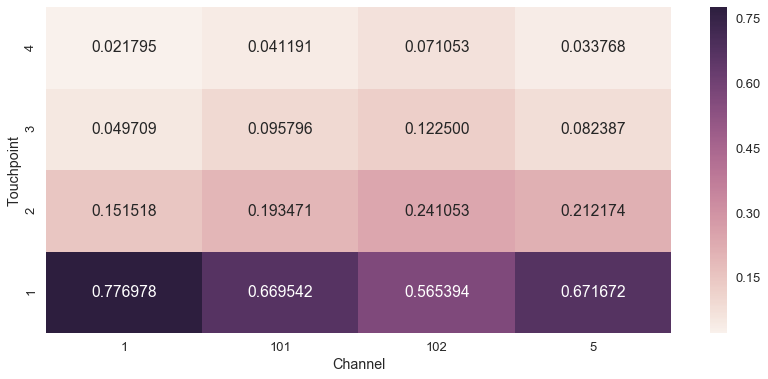
This shows the contribution of different channels at different timesteps of the user-journeys. For example, channel 1 is very instrumental towards the end of the user journeys as 78% of the total conversions is attributed to the last touch-point.
Media Channel Influence Evaluation
A very important point that is often overlooked is the model validation part. Most of the times we have no “ground truth” to compare against, what I mean to say is that no where we have information that this channel should get 30% of the total conversions and we are giving it 29% so the model is working alright.
So we have to look at other ways, one way is to perform lift analysis where based on the predictions we would carefully implement changes and observe changes in the KPI accounting for all seasonal factors, by doing this we will be able to evaluate the effectiveness of recommendations suggested by the attribution model.