Recently HackerEarth organised a machine learning competition in which we had to predict probability of an ad getting clicked or not. I managed to secure 32nd position out of around 5000 participants registered at this event. In this post I would like to present how I came about creating a pipeline that could model the underlying process.
Problem Statement
A leading affiliate network company from Europe wants to leverage machine learning to improve (optimise) their conversion rates and eventually their topline. Their network is spread across multiple countries in europe such as Portugal, Germany, France, Austria, Switzerland etc.

Affiliate network is a form of online marketing channel where an intermediary promotes products / services and earns commission based on conversions (click or sign up). The benefit companies sees in using such affiliate channels is that, they are able to reach to audience which doesn’t exist in their marketing reach.

The company wants to improve their CPC (cost per click) performance. A future insight about an ad performance will give them enough headstart to make changes (if necessary) in their upcoming CPC campaigns.

In this challenge, we had to predict the probability whether an ad will get clicked or not.
Data Description
Variables in this data set are anonymized due to privacy.
The training data is given for 10 days ( 10 Jan 2017 to 20 Jan 2017). The test data is given for next 3 days. Leaderboard has (40-60) split which means public leaderboard would use only 40% of the test data and rest 60% would be used to construct private leaderboard which would determine final positions.
| Variable | Description |
|---|---|
| ID | Unique ID |
| datetime | timestamp |
| siteid | website id |
| offerid | offer id (commission based offers) |
| category | offer category |
| merchant | seller ID |
| countrycode | country where affiliates reach is present |
| browserid | browser used |
| devid | device used |
| click | target variable |
Size of training set is around 897 MB and test set is around 259 MB and all of the features are categorical.
Evaluation Metric
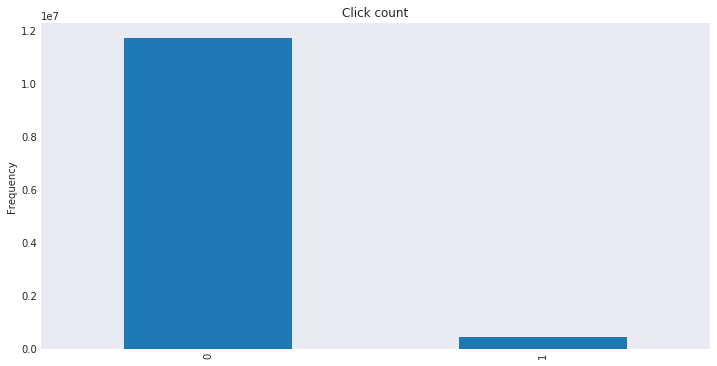
AUC ( Area under curve ) was chosen as the evaluation metric by the organisers and rightly so becuase of the imbalance in the target variable. Very few ads received a click and if accuracy would have been chosen as the metric then a model that would always predict ‘no’ click would get 96.3% accuracy on the train set, that would not have been ideal. You would like a model that would predict whether an ad would get a click or not which will have an impact in the decision making process. You can read more about the metric here
Exploratory Data Analysis
Data Snapshot
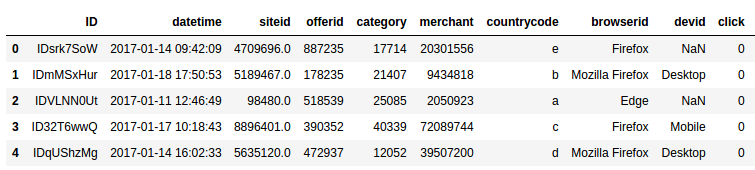
There are 12137810 examples in the training set and 3706907 examples in the test set.
Snapshot of some of the examples in the training set
Missing values
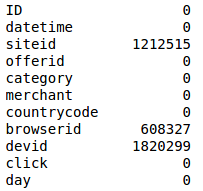
Siteid, browserid and devid have missing values. We need to somehow fill the missing values. We tried to impute some of the missing data by looking at combination of browser and device. We found out that for some of the browsers only certain devices were targeted in the training set and using this information we filled some of the gaps in the devid. For rest of the missing values we used -9999 as the value that would represent whether value is missing or not.
Cross Validation
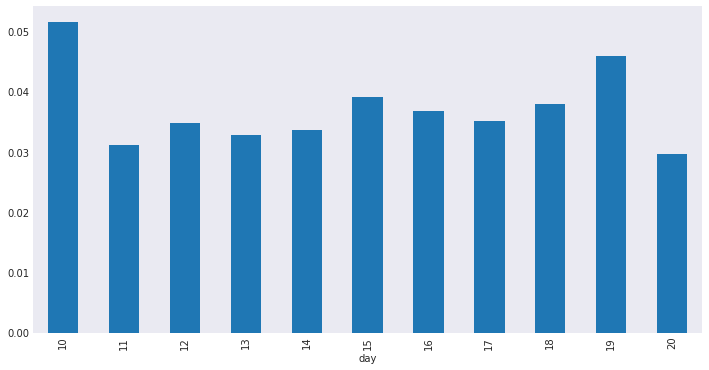
After looking at the click probability by day we took a decision to not create time based split of training data but instead created two folds (50-50) and ran all the models against these two splits for comparison.
Pipeline
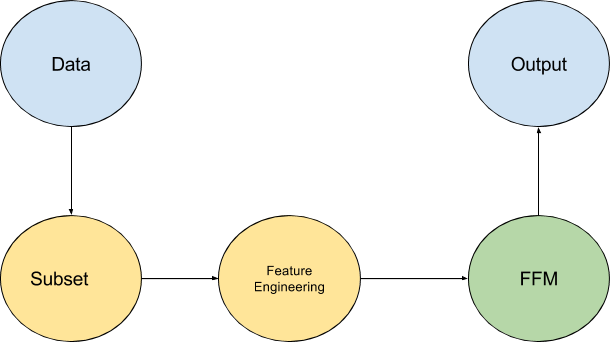
Subset
In this competition, instead of working with full dataset, we included only those siteids that were present both in train and test set. This gave us slightly better performance on the local validation set.
Feature Engineering
Except the raw features, we generated following additional features
- Decompose datetime into hour.
- Count based features. ( It is assumed that features with same count behave similarly. )
- Siteid count
- Category count
- Offerid count
- Merchant count
- Browser count
- Device count
- Hour count
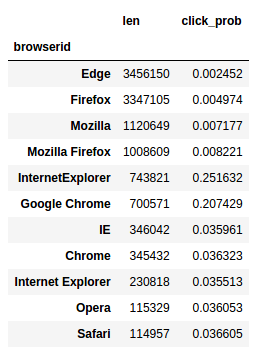
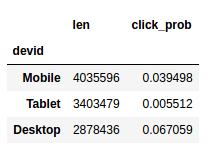
Above plots show browser and device have a lot of predictive power.
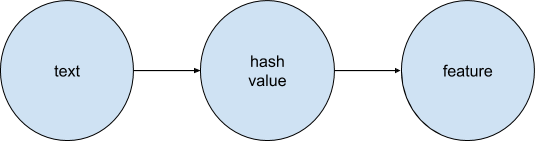
Hashing trick
We used hashing trick to transform text features. It is a way of applying a hash function to the text features and using their hash values as indices directly.
siteid_123131 8971983619361936911936 911936
Model
We used field aware factorization machines which have proved to work very well with this kind of data where most of the features are categorical with very high cardinality. To give a general sense of why this method works for these kind of problems, we need to know what is matrix factorization and how all of this related to predicting whether an ad would get clicked or not.
Matrix Factorization
It is a way of decomposing a matrix into a product of matrices. In case of recommender systems, given user-items matrix Matrix Factorization maps both users and items to a joint latent space of dimension k. Each dimenstion of the latent factor space can be explained as topic, say comedy vs drama and interaction between user and item can be modelled as the inner product in this space.
Factorization Machines
In this problem an impression is composed of multiple features like (site id, offer id, category, browser, device, hour of day, merchant). So instead of decomposing the matrix formed by each feature pair (site id, offer id) we can use factorization machines to project each feature in the latent space and then we can deal with feature interactions ( site id, category ), (site id, offer id ) … . It can deal with sparse data pretty well. We create these feature interactions because we want to know the relationship between the pair ( site id, category ) and the target variable.
Field Aware Factorization Machines
Factorization Machines are able to model interaction between two features but what if there are more than 3 dimensions. For example in this problem we have website, offer, merchant etc. There is not only interaction between website and offer, offer and merchant but also among all 3 features. Field aware factorization machines can handle these interactions. Here field means dimension (siteid, offerid, category …). for example
| publisher | advertiser | gender |
|---|---|---|
| ESPN | NIKE | MALE |
| VOGUE | GUCCI | FEMALE |
FFM would create latent vector as
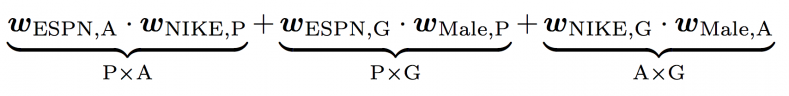
We see that to learn latent effect of (ESPN, NIKE), wespn_a is used because NIKE belongs to field advertiser and wnike_p is used because ESPN belongs to field Publisher.
In case of FM, we see
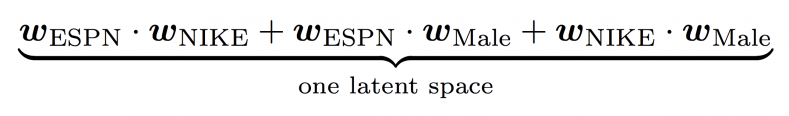
There is only one latent space, so Wespn is used to learn the effect of with NIKE and MALE, which is a limitation which is addressed by FFM as it uses different weight vectors for every feature based on the field of other feature in the pair.
Parameter Tuning
You can specify k ( which is the number of dimensions of the latent vector ) and t ( training iterations ) to get the most out of your model. We used the two folds (50-50) to come up with the optimal settings.
Running this whole pipeline gave us .68047 AUC on the private leaderboard.
I hope that this might give you an intuition about how to solve these kind of problems. As always looking forward to your comments and feedback.