Today happens to be my last day of the internship - and so, is a good time to pause and ponder of the weeks that flew by. As part of this blog post, I plan to share what I worked on, learnings and my overall experience.
In the past seven weeks, I created a dashboard using Microsoft’s Business Intelligence(BI) and data visualization tool – Power BI. I had a chance to appreciate the visual platform provided by the tool. I also learned that it is very important to choose the right visual to represent your data. A careless choice can leave the client confused. The task is easy when your goal is to just put visuals together using the various options available by the Tool. It becomes more challenging when you look at the dashboard as a product for your client. Every dashboard should tell a story. BI tools help polish data into effortlessly understandable visuals to the viewer.
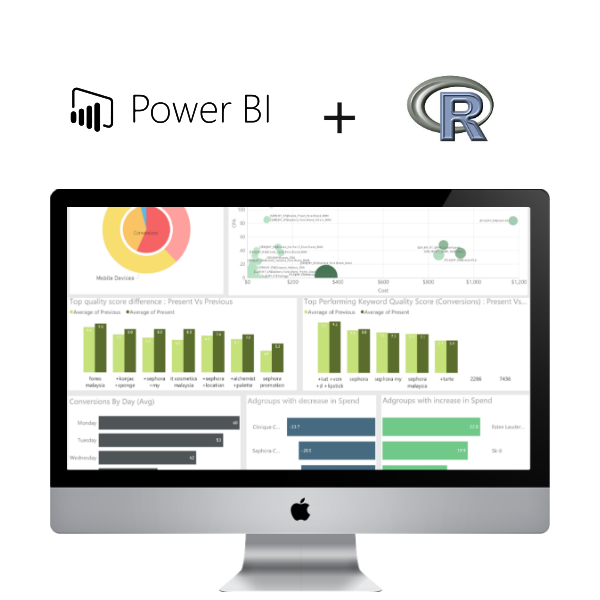
Power BI allows you to create computed measures, tables and columns using DAX – Data Analytics Expressions. DAX is a simple query and formula language. Their functions on tables range from statistical calculations like “SUM” and “AVERAGE” to FILTER operations and grouping. I found their Time Intelligence functions like “DATEADD” and “PARALLELPERIOD” particularly interesting. These functions are extremely powerful when you want to compare data for a certain attribute over different periods of time. DAX fails when you want to store your visual data in a temporary and operate on that data. Here’s where R scripts come to the rescue. I worked on an algorithm in R which selectively produced different visuals based on certain conditions met. However, R visuals are still not supported by Power BI’s web URLs. Another shortcoming of Power BI is that it offers very limited help for alignment of visuals in a report. It makes this process manually tedious.
Data has always interested me. Looking into the future, I intend to work for a couple of years and then pursue a Masters in Data Science or an MBA.
The environment at DeltaX is very relaxed yet conducive to immense learning. Everyone here is so passionate about their work and strive for perfection. I am really impressed by how problems are solved at DeltaX, especially the brainstorming sessions around the whiteboard. I would like to thank everyone at DeltaX for making it such a fun and fruitful place to work at. I sincerely thank Priyank and Krishna for being such amazing and patient mentors who were always ready to help. Not to miss Amrith and Akshay for giving me this opportunity.
All in all, this was a sprint that was worth it!